Closify Sales Real Estate Dashboard: A Strategic Tool for Modern Property Sales Teams
Real estate sales is, at its core, a discipline of timing, data, and human judgment. Every agent, broker, and proptech founder knows that the difference between a closed deal and a lost lead often comes down to how quickly you can interpret your pipeline and act. The Closify Sales Real Estate Dashboard enters this space as a purpose-built interface designed to turn raw transaction data into clear, actionable insight. It is not merely a collection of charts and cards. It is a decision-making environment that, when used with intention, can reshape how a team prioritises, communicates, and closes.
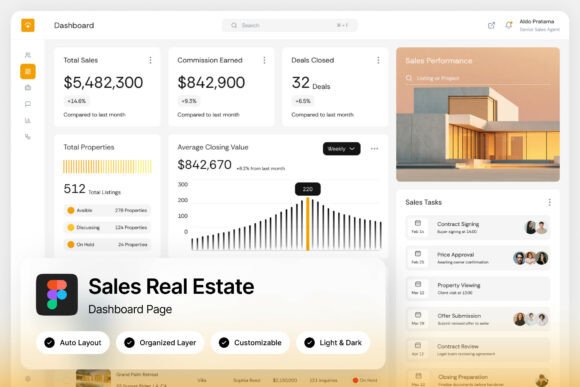
What makes the Closify Sales Real Estate Dashboard strategically useful goes beyond its visual polish. At its core, it is a workflow tool disguised as an analytics screen. By combining property listings, deal pipelines, revenue cards, and sales performance charts into a single, cohesive view, it allows you to move from observation to action without switching between spreadsheets, email threads, or separate CRM modules. This reduction in friction is where real productivity gains appear, especially in fast-moving markets where a property can receive multiple offers within days of listing.
Why the Design of Your Dashboard Affects Your Sales Outcomes
Most real estate professionals underestimate how much their tools shape their thinking. A cluttered, dark, or overly complex dashboard encourages reactive behaviour, hunting for numbers, second-guessing priorities, and missing trends. The Closify Sales Real Estate Dashboard deliberately uses a light and earthy color palette, clean card layouts, and a resolution of 1440×1024 pixels that fits naturally on standard monitors. This is not decorative. It is functional. When your brain does not have to work to parse the interface, it can focus on the actual decisions: which lead needs a follow-up today, which listing is underperforming, or whether your team is on track for quarterly revenue targets.
For agencies managing multiple agents, this clarity scales. A dashboard that is intuitive reduces the training burden. New team members can interpret the pipeline within minutes, not days. For proptech startups building property sales or lead management platforms, the layout of the Closify Sales Real Estate Dashboard offers a reference point for user experience design that prioritises conversion. Every element, from the revenue cards to the performance charts, is arranged to support a high-conversion CRM workflow, not just display data.
Planning Your Approach Before Implementing the Dashboard
Before you integrate a dashboard like Closify into your operations, it is worth stepping back and clarifying what you actually need from it. The tool itself is fully customizable, with well-organised, named, and grouped layers in Figma, which means you can adapt it to your specific metrics. But customization without a plan creates noise.
Consider these strategic questions first:
- What decisions do you make most often? If you are a solo agent, your priority might be lead response time and showing conversion. If you run a team of ten, you may need to track agent performance and deal velocity.
- What metrics indicate healthy progress? Not all numbers are useful. Focus on leading indicators, like new leads per week and offers submitted, rather than only lagging ones like closed revenue.
- How often will you review the dashboard? A daily review habit changes how you use the tool. If you only look at it weekly, the level of detail you need shifts.
By answering these questions first, you set the Closify Sales Real Estate Dashboard up to support your actual workflow, rather than forcing your workflow to fit the dashboard. This is the difference between using a tool intentionally and merely having it open on your screen.
Practical Use Cases for Agents, Teams, and Product Builders
The Closify Sales Real Estate Dashboard is not a one-size-fits-all solution, but its flexibility makes it relevant across several real-world scenarios. Here are three distinct ways to approach it, depending on your role and goals.
For the Independent Agent
If you are a solo agent or small team owner, your biggest challenge is time. You need to know at a glance which deals are moving forward and which are stalled. Using the deal pipeline view in Closify, you can quickly spot a listing that has been sitting in the negotiation stage for two weeks without movement. That visual cue triggers a specific action, perhaps a call to the buyer's agent or a price adjustment discussion with the seller. The revenue cards also give you a real-time sense of your monthly progress, which helps with both personal motivation and realistic target setting.
For the Growing Agency
When you manage multiple agents, your focus shifts from individual transactions to team performance and coaching. The sales performance charts in Closify become your coaching tool. You can identify which agents are converting at higher rates and what behaviours lead to that success. You can also see if the overall pipeline is healthy or if too many deals are concentrated in one stage. This allows you to redistribute resources, offer training to agents who are stuck, or adjust your listing strategy based on what the data reveals about market demand.
For the Proptech Product Team
If you are building a property sales or lead management platform, the Closify Sales Real Estate Dashboard serves as a reference for UI design and user experience. The pixel-perfect layout, the thoughtful use of light and dark modes, and the logical grouping of data elements all reflect design decisions that reduce cognitive load for your users. By studying how Closify organises information, you can make better choices about how your own dashboard should prioritise content. The free Google Fonts included in the kit also make it easy to align the dashboard with your brand without custom typography work.
What to Consider Before Relying on Any Dashboard
Every tool has limitations, and the Closify Sales Real Estate Dashboard is no exception. The biggest risk is not in the dashboard itself, but in how it is used. A dashboard is a representation of your data, not a substitute for understanding your business. If the data feeding it is inaccurate, incomplete, or outdated, the dashboard will look polished but mislead you. Garbage in, garbage out remains true regardless of how clean the interface is.
Another risk is over-reliance on visual cues without context. A drop in the pipeline might look alarming on a chart, but it could simply reflect seasonality or a strategic decision to focus on higher-value listings. The dashboard cannot explain the story behind the numbers. That requires human judgment, regular conversation with your team, and direct knowledge of your market.
Finally, there is the risk of customization without discipline. The Closify dashboard is fully customizable, which is a strength, but it can also become a trap. If you keep adding metrics, cards, and data points, you will eventually recreate the clutter you were trying to escape. The most effective dashboards are limited to the few metrics that drive your most important decisions. When you modify the Figma file, ask yourself whether each new element actually changes how you act. If it does not, leave it out.
Long-Term Value and Strategic Positioning
Used consistently and thoughtfully, the Closify Sales Real Estate Dashboard can become a central part of your sales operations. Over time, the patterns you observe in the performance charts and pipeline data will sharpen your intuition about market cycles, client behaviour, and team capacity. You will develop a vocabulary for discussing strategy that is grounded in real numbers, not just anecdotes.
For agencies, this translates into better positioning. When you can show a potential listing client a clear, professional dashboard that tracks your current pipeline, deal velocity, and revenue progress, you build credibility. It signals that you run your business with discipline. For internal team meetings, the dashboard provides a neutral reference point for discussions about performance, targets, and resource allocation. It depersonalises the data and makes it easier to have honest conversations about what is working and what is not.
From a brand perspective, the modern, warm aesthetic of Closify also matters. If you share your dashboard in client meetings or internal presentations, the design reinforces a professional image. The light and dark mode flexibility means you can adapt the visual style to your brand guidelines or to the lighting conditions of your presentation room. Small details like this contribute to the overall perception of your agency as organised, modern, and client-focused.
Making the Dashboard Part of a Larger Decision-Making System
No dashboard, no matter how well designed, replaces the need for a sound sales process, regular team communication, and market knowledge. The Closify Sales Real Estate Dashboard works best when it sits within a broader system of weekly check-ins, clear lead assignment protocols, and defined follow-up cadences. Its job is to make that system visible and measurable, not to create it from scratch.
If you are an entrepreneur or small business owner building a real estate platform, the dashboard file itself, delivered as a Figma file with a help guide and font links, gives you a ready-made starting point for your UI development. You can adapt the layers, modify the colours, and integrate your own data points without needing to design from zero. This accelerates your product timeline and lets you focus on backend logic and user research instead of pixel placement.
For educators and trainers teaching real estate sales or CRM usage, the Closify dashboard also works as a teaching tool. You can walk students through the pipeline stages, explain how revenue cards reflect monthly performance, and show how charts can reveal patterns over time. It gives you a concrete visual reference for abstract concepts like deal velocity, conversion rate, and pipeline health.
Final Thoughts on Using Closify Sales Real Estate Dashboard Intentionally
The Closify Sales Real Estate Dashboard is more than a set of attractive screens. It is a framework for seeing your business clearly. But clarity is not automatic. It comes from thoughtful setup, disciplined use, and honest interpretation of what the data tells you. If you approach this tool with clear goals, a commitment to accurate data, and a willingness to adjust your process based on what you learn, it will serve you well. If you install it and glance at it occasionally without context, it will remain a pretty interface with limited impact.
Whether you are a solo agent tracking your own pipeline, a team leader coaching agents, or a product designer building the next generation of real estate software, the decisions you make about how you see your data matter. The Closify Sales Real Estate Dashboard gives you a strong foundation for those decisions. The rest depends on how you choose to use it.