Sellora AI Sales Assistant Dashboard: Redefining Sales Intelligence with Bold Design
In the fast-paced world of SaaS and sales technology, the dashboard is the command center. It is where decisions are made, trends are spotted, and revenue is tracked. Yet, many sales dashboards fall short — cluttered with data, lacking visual hierarchy, or simply uninspiring. Enter Sellora AI Sales Assistant Dashboard, a bold, data-driven sales dashboard UI built with a deep red and dark theme. Designed for clarity, impact, and actionable insights, Sellora is not just another template — it is a statement. Whether you are a UI/UX professional, a startup founder, or a SaaS product designer, understanding what makes Sellora stand out can transform how you think about sales intelligence platforms.
This article explores Sellora from the ground up: its purpose, design philosophy, key features, and practical relevance. By the end, you will have a comprehensive understanding of why this dashboard matters and how it fits into the broader landscape of modern sales tools.
What Is Sellora AI Sales Assistant Dashboard?
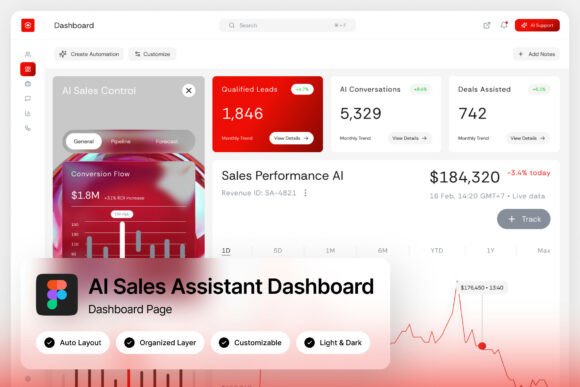
At its core, Sellora is a high-fidelity UI design for a sales assistant dashboard. It is not a live software application but a meticulously crafted Figma file that provides a pixel-perfect blueprint for building a sales intelligence interface. The design is built around a deep red and dark theme, giving it a distinctive, premium aesthetic that immediately conveys authority and focus.
The dashboard includes essential components such as KPI cards, revenue charts, performance metrics, and a sales pipeline overview. Everything is organized in a clean, modern layout with vivid data visualizations that make numbers tell a story. Sellora is designed at a resolution of 1440×1024 px, making it ideal for desktop applications and web-based CRM platforms.
But Sellora is more than just a collection of charts and cards. It represents a design philosophy that prioritizes clarity, emotion, and usability. The bold color palette and dark background are not arbitrary — they are chosen to reduce eye strain, highlight critical data, and create a sense of depth and sophistication.
Why a Purpose-Built Sales Dashboard Matters
In any sales-driven organization, the dashboard is the single source of truth. It aggregates data from multiple sources — CRM, email campaigns, ad spend, pipeline stages — and presents it in a unified view. A well-designed dashboard helps teams:
- Monitor real-time performance — See how deals are progressing and where bottlenecks exist.
- Identify trends — Spot seasonality, product performance shifts, or regional variations.
- Make data-driven decisions — Allocate resources, adjust quotas, and prioritize leads based on concrete numbers.
- Communicate results — Share clear visuals with stakeholders, investors, or team members during stand-ups and reviews.
Yet, many dashboards fail because they try to show everything at once. Information overload leads to decision paralysis. Sellora addresses this by focusing on key performance indicators (KPIs) that matter most — revenue, conversion rates, deal velocity, and pipeline health. The visual hierarchy guides the eye naturally from high-level metrics to detailed breakdowns.
A Bold, Dark Aesthetic with Purpose
The dark mode interface is a defining feature of Sellora. Dark UIs are not merely a trend — they offer tangible benefits for data-heavy applications. Reduced blue light emission lessens eye fatigue during long work sessions. High contrast between background and data elements makes numbers and charts pop. And the deep red accent adds a sense of urgency and energy, which is fitting for a sales environment where every metric matters.
Sellora includes both light and dark mode variants, giving designers flexibility. The dark mode is particularly effective for immersive, focused work, while the light mode offers a more traditional, airy feel for presentations or client demos.
Clean Typography and Vivid Data Visualizations
Typography in Sellora uses free Google Fonts, ensuring that the design remains accessible and easy to customize. Clean sans-serif fonts improve readability at a glance, which is critical when users scan dashboards quickly. The data visualizations — bar charts, line graphs, progress bars, and funnel diagrams — use vivid, high-contrast colors that stand out against the dark background. This makes it easy to distinguish between metrics, compare values, and spot anomalies.
Pixel-Perfect, Fully Customizable Layers
One of the strongest selling points of Sellora is its well-organized, named, and grouped layers in Figma. For designers, this means no hunting through dozens of unnamed frames. Every element — from the KPI cards to the navigation icons — is logically structured and easy to edit. The design is fully customizable, allowing teams to adapt it to their brand colors, swap out data points, or integrate new widgets without rebuilding the entire layout.
Key Components of the Sellora Dashboard
Let us walk through the main building blocks that make Sellora a complete sales intelligence interface.
1. KPI Cards
These are the first thing users see at the top of the dashboard. Each card displays a single, critical metric — such as total revenue, active deals, win rate, or average deal size. The cards use a compact layout with a small icon, a large number, and a trend indicator (up or down arrow with percentage). This design allows users to absorb the most important information in under two seconds.
2. Revenue Charts
Below the KPI cards, the revenue section provides a time-series visualization of revenue performance. Users can see daily, weekly, or monthly trends at a glance. The chart is designed with smooth curves and clear axis labels, making it easy to identify growth patterns or seasonal dips. Interactive tooltips (simulated in the Figma file) show exact values on hover.
3. Performance Metrics
This section dives deeper into individual and team performance. Metrics like calls made, emails sent, meetings booked, and deals closed are displayed in a grid or list format. Each metric includes a progress bar or gauge, giving a quick sense of how close the team is to their targets.
4. Sales Pipeline Overview
The pipeline view is the heart of any sales dashboard. Sellora presents a funnel or stage-based visualization showing the number of deals at each stage — from lead generation to closed won. This helps managers understand where deals are getting stuck and where to focus coaching or resources. The pipeline is color-coded and proportionally sized, making it instantly readable.
Who Is Sellora For?
Sellora is designed with a specific audience in mind, but its utility extends across several roles:
- SaaS product designers — Use Sellora as a reference or starting point for building CRM dashboards. The organized layers and clean design make it easy to adapt for different products.
- Startup founders — If you are building a sales intelligence platform or a CRM, Sellora gives you a polished, investor-ready UI concept to present during pitches or beta launches.
- UI/UX professionals — Study Sellora to understand how dark themes, red accents, and data visualization can work together to create an engaging, functional interface.
- Product managers and sales operations teams — Use the dashboard as a mockup to communicate requirements to developers or to test user flows before coding begins.
Practical Relevance in Modern Business
In 2025 and beyond, data-driven decision-making is no longer optional — it is the baseline. Companies that can visualize their sales data clearly and act on it quickly have a competitive edge. Sellora fits directly into this reality by providing a design that is both aesthetically compelling and functionally grounded.
The dashboard is particularly relevant for:
- Remote sales teams — A clean, centralized dashboard helps distributed teams stay aligned on goals and progress.
- B2B SaaS companies — These organizations often deal with complex sales cycles and need pipeline visibility to forecast revenue accurately.
- Sales intelligence platforms — Tools like Gong, Outreach, or Salesforce could use a UI like Sellora to present insights in a more digestible way.
Common Misunderstandings About Dashboard Design
One frequent misconception is that a good dashboard must show everything. In reality, the best dashboards show only what matters. Sellora embraces this principle by limiting the number of visible metrics and using visual weight to prioritize critical data.
Another misunderstanding is that dark themes are purely cosmetic. In practice, dark mode reduces glare and cognitive load, especially when users spend hours analyzing data. Sellora’s dark theme is a functional choice that supports sustained focus.
Finally, some assume that a Figma file like Sellora is only for final mockups. But it can also be used for user testing, stakeholder presentations, design system components, and developer handoffs. Its pixel-perfect layout ensures that what is designed in Figma can be faithfully translated into code.
What You Get in the Sellora Package
When you download Sellora, you receive a comprehensive set of files designed to accelerate your workflow:
- .fig file — The complete Figma file with all screens, layers, and components.
- Help Guide .pdf — A step-by-step guide to help you open, customize, and export the design.
- Font Links .txt — Direct links to the free Google Fonts used in the design, so you can install them easily.
Note: The images shown in previews are for demonstration purposes only and are not included in the download. All design elements are original and ready for customization.
How Sellora Fits into the Larger Ecosystem
Sellora is more than a standalone UI — it is a building block for a complete sales intelligence platform. When combined with a robust backend, a CRM API, and real-time data feeds, this dashboard becomes the front-facing layer that users interact with daily. For designers and founders, starting with a well-thought-out UI like Sellora saves weeks of design iteration and ensures a consistent, professional look from day one.
The dashboard also aligns with modern design trends such as glassmorphism, neumorphism, and data-driven storytelling. The vivid charts and cards are designed to be both informative and visually engaging, turning raw numbers into a narrative that teams can rally around.
Final Thoughts
The Sellora AI Sales Assistant Dashboard is a testament to what happens when bold aesthetics meet practical data design. Its deep red and dark theme, combined with crystal-clear KPIs, revenue charts, performance metrics, and pipeline views, make it a powerful tool for anyone building or designing sales software. Whether you are a seasoned UI/UX professional or a founder sketching out your first CRM, Sellora provides a strong foundation that is both beautiful and functional.
In a world where every business is becoming a data business, the dashboard is the new storefront. Make it count.