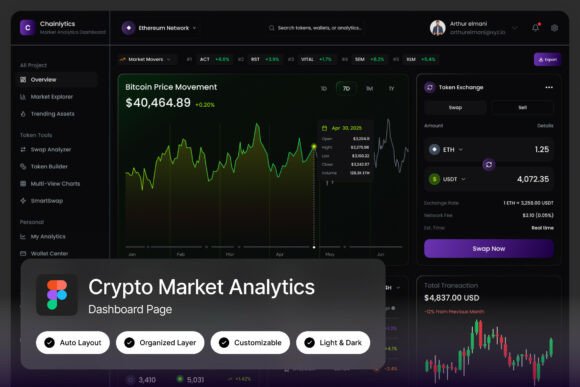
Chainlytics Crypto Market Analytics Dash: Smarter Data, Sharper Decisions
The difference between surviving and thriving in digital asset markets often comes down to how quickly you can read the data. With price swings measured in seconds and liquidity pools shifting by the minute, a cluttered or slow interface is more than a nuisance—it is a liability. That is precisely where the Chainlytics Crypto Market Analytics Dash enters the picture. Designed from the ground up for blockchain platforms, cryptocurrency market tracking systems, DeFi applications, and digital asset monitoring services, this template delivers a futuristic financial layout that makes complex data feel almost intuitive.
Rather than forcing you to piece together charts from scattered widgets, the Chainlytics Crypto Market Analytics Dash gives you two high-quality admin screens, each rendered at a full 1440×1024 pixel resolution. That resolution matters. It means you see the full breadth of market activity without excessive scrolling or zooming, and it aligns with the screen sizes most professionals use daily. Whether you are monitoring a DeFi lending protocol, tracking NFT floor prices, or managing a multi-chain portfolio, the layout respects your time by putting the most critical metrics front and center.
Built for Real-World Analytics Workflows
The crypto space does not tolerate generic design. A template that looks good in a portfolio but fails under real data loads is worse than useless. The Chainlytics Crypto Market Analytics Dash avoids that trap by focusing on advanced data visualization components that actually behave the way financial analysts expect. Candlestick patterns, volume histograms, moving average overlays, and on-chain metrics like TVL (Total Value Locked) or active wallet counts all have dedicated, well-positioned spaces within the interface.
What makes this template genuinely useful for modern workflows is how it handles the tension between depth and clarity. You can drill into granular data without losing the overview. For example, a DeFi analyst might start by scanning the top-level market cap and 24-hour volume figures, then click through to examine individual token liquidity spreads or protocol revenue trends. The pixel-perfect layout ensures that every transition feels seamless, and the well-organized, named, and grouped layers mean that if you choose to customize the dashboard, you won't waste hours hunting for the right element.
Light and Dark Mode Without the Headache
Ask any crypto trader about their screen setup, and you will hear strong opinions about dark mode. Staring at bright white backgrounds for hours while monitoring volatile markets can lead to eye strain and slower reaction times. The Chainlytics Crypto Market Analytics Dash includes both light and dark interface options, and crucially, each mode maintains full readability for all data visualization components. That is harder to achieve than it sounds. Color-coded elements like green and red price movements, gradient heatmaps, and semi-transparent overlay charts need to remain equally distinguishable regardless of background.
The dark mode is not an afterthought. It preserves contrast ratios that matter for real trading decisions, and the light mode stays clean without feeling harsh. Whether you are building a dashboard for a DeFi protocol's internal team or a public-facing analytics tool for retail investors, offering both modes from a single Figma file saves you days of rework.
What Is Actually Inside the File
Let's talk specifics. When you download the Chainlytics Crypto Market Analytics Dash, you receive a .fig file compatible with Figma, a Help Guide in PDF format, and a Font Links .txt file that directs you to the free Google Fonts used throughout the design. That last detail is worth emphasizing because licensing surprises are a common frustration in web design. All fonts here are free and open-source, so you will not run into billing issues when moving to production.
The two included screens cover the most common scenarios in crypto analytics: a broad market overview dashboard and a focused asset detail view. The overview screen shows aggregate data—total market capitalization, top gainers and losers, volume trends, and sector performance. The detail screen dives into a single asset or protocol, displaying price history, order book depth, funding rates (for derivatives), and relevant on-chain indicators. This pairing covers roughly 80 percent of the use cases a crypto analytics platform needs on day one.
Fully Customizable Without Causing Chaos
Every professional designer or developer has opened a template with poorly named layers and felt immediate regret. The Chainlytics Crypto Market Analytics Dash deliberately avoids that pain. Layers are named according to their function—something like "ETH_Price_Chart_Area" rather than "Rectangle 47"—and they are grouped logically by screen section. If you need to swap out the example data for live API feeds, adjust color schemes to match brand guidelines, or replace chart types, you can do so without guessing which layer affects what.
This organizational discipline is especially valuable for teams. Multiple designers can work on different sections of the dashboard simultaneously, merge their changes, and maintain consistency across screens. The unique and stylish design language remains intact, but the template bends to your workflow rather than forcing you to adapt to its quirks.
Why Precision Matters in Financial Interfaces
Crypto analytics dashboards are not decorative. Every pixel of spacing, every font weight, and every color choice either aids or hinders a financial decision. The 1440×1024 pixel resolution in the Chainlytics Crypto Market Analytics Dash is not just a number—it is a deliberate choice that balances information density with readability. At that resolution, you can display real-time price feeds alongside historical trend lines without either element feeling cramped.
Consider a scenario common in DeFi monitoring: you are tracking a liquidity pool's impermanent loss risk while simultaneously watching the underlying token's price action. If the dashboard forces you to toggle between views or resize panels manually, you risk missing a critical pivot point. The template's layout anticipates these simultaneous monitoring needs by placing complementary data types in visible proximity, reducing the cognitive load of switching contexts.
Practical Benefits for Developers and Designers
If you are a developer integrating this template into a React, Vue, or Angular application, the clear layer structure and consistent component naming pay dividends during the handoff. You can inspect a single chart component, understand its styling hierarchy, and replicate it across the application without reverse-engineering the design file. The support for free Google Fonts also means there is no need to negotiate font licensing with clients or legal teams.
For designers working on branded analytics platforms, the template's modern, futuristic aesthetic serves as a strong foundation. You can easily replace the color palette to match a client's brand while retaining the visual hierarchy that makes the dashboard effective. The included Help Guide walks through the basics of editing and exporting, but the well-organized layers make that guide almost optional for experienced Figma users.
Who Benefits Most from This Template
The Chainlytics Crypto Market Analytics Dash fits a broad range of projects, but certain use cases benefit more than others. Blockchain platforms building their own analytics dashboards for ecosystem participants can use the template to standardize how data is presented across different protocols. Cryptocurrency market tracking services, whether new startups or established platforms refreshing their UI, will find the data visualization components ready for real market data input.
DeFi applications are perhaps the most natural fit. These platforms generate massive amounts of structured data—yield rates, liquidation thresholds, borrowing demand, and governance participation—that need clear visualization. The template's layout accommodates both time-series data and cross-sectional comparisons, which are common in DeFi analytics. Digital asset monitoring services, including portfolio trackers and risk management tools, also benefit from the template's ability to display multiple asset classes simultaneously without visual noise.
A Thought on Implementation
One recommendation for anyone adopting this template: spend time early mapping your real data fields to the template's example placeholders. The Chainlytics Crypto Market Analytics Dash is designed for easy editing, but the real effort comes in connecting it to live data sources. Clean APIs and well-structured JSON responses will make the integration smooth, and the template's pixel-perfect layout will reward that effort by remaining stable across different data states. Empty states, loading indicators, and error messages are easier to design when the baseline layout is already solid.
What the Zip File Does Not Include (and Why That Matters)
It is important to note that the images shown in previews are for demonstration purposes only and are not included in the download. This is standard practice for design templates, but it is worth knowing upfront. You are paying for the structural design—the carefully tuned component spacing, the responsive behavior logic, the typographic hierarchy—not for stock screenshots of imaginary market data. Your real data will look better in the template than any preview image could, because the design was built to handle variable content lengths, fluctuating numbers, and dynamic chart updates.
The included .fig file is the core asset. With it, you have full control over every element, from the color of a single candlestick to the opacity of a gradient background. The Help Guide PDF covers the basics, and the Font Links .txt removes any guesswork about which typefaces to install. Between those three files, you have everything you need to transform a generic analytics concept into a polished, production-ready interface.
In a market where first impressions are measured in milliseconds, the Chainlytics Crypto Market Analytics Dash provides a distinctive, functional foundation that respects both the user's need for clarity and the developer's need for maintainability. Whether you are launching a new DeFi dashboard, overhauling an existing cryptocurrency tracking platform, or prototyping a digital asset monitoring service, this template gives you a significant head start without locking you into rigid design choices.